

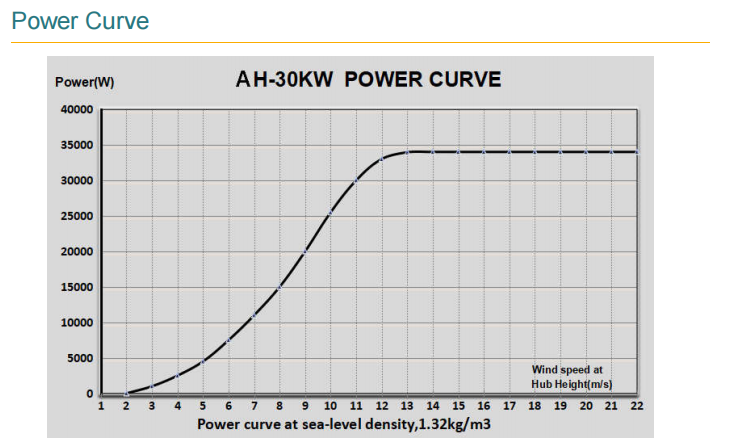
Wind Turbines Power Curve
The power curve is composed of wind speed as an independent variable (X), the active power acts as the dependent variable (Y) to establish the coordinate system. A scatter plot of wind speed and active power is fitted with a fitting curve, and finally a curve that can reflect the relationship between wind speed and active power is obtained. In the wind power industry, the air density of 1.225kg/m3 is considered to be the standard air density, so the power curve under the standard air density is called the standard power curve of wind turbines.
According to the power curve, the wind energy utilization coefficient of the wind turbine under different wind speed ranges can be calculated. The wind energy utilization coefficient refers to the ratio of the energy absorbed by the blade to the wind energy flowing through the entire blade plane, generally expressed in Cp, which is a percentage of the energy absorbed by the wind turbine from the wind. According to Baez's theory, the maximum wind energy utilization coefficient of wind turbines is 0.593. Therefore, when the calculated wind energy utilization coefficient is greater than the Bates limit, the power curve can be judged to be false.
Due to the complex flow field environment in the wind farm, the wind environment is different at each point, so the measured power curve of each wind turbine in the completed wind farm should be different, so the corresponding control strategy is also different. However, in the feasibility study or micro-site selection stage, the wind energy resource engineer of the design institute or wind turbine manufacturer or owner can only rely on the input condition is a theoretical power curve or a measured power curve provided by the manufacturer. Therefore, in the case of complex sites, it is possible to obtain different results than after the wind farm is built.
Taking the full hours as the evaluation criterion, it is likely that the full hours in the field are similar to the previously calculated values, but the values of the single point vary greatly. The main reason for this result is the large deviation in the assessment of wind resources for the locally complex terrain of the site. However, from the perspective of power curve, the operating power curve of each point in this field area is quite different. If a power curve is calculated according to this field, it may be similar to the theoretical power curve used in the previous period.
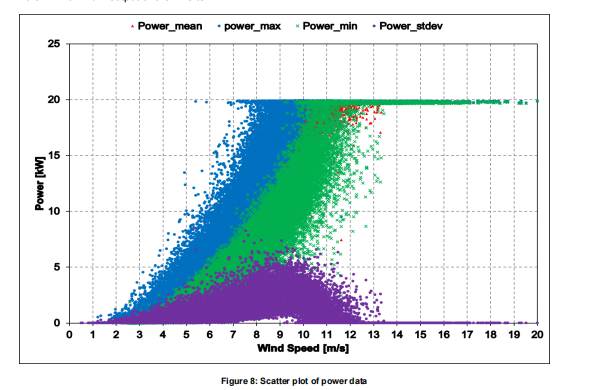
At the same time, the power curve is not a single variable that changes with the wind speed, and the occurrence of various parts of the wind turbine is bound to cause fluctuations in the power curve. The theoretical power curve and the measured power curve will try to eliminate the influence of other conditions of the wind turbine, but the power curve during operation cannot ignore the fluctuation of the power curve.
If the measured power curve, the standard (theoretical) power curve and the formation conditions and uses of the power curve generated by the operation of the unit are confused with each other, it is bound to cause confusion in thinking, lose the role of the power curve, and at the same time, unnecessary disputes and contradictions will arise.

Q7FMN}}}[X_C1.png)
Post time: Apr-20-2023